Prompt Files
Prompt files are Markdown format text files with a YAML format header (also known as frontmatter) that contain reusable prompts. You can use prompt files to simply help your run the same set of prompts repeatedly, or, use them to define a simple workflow.
All prompt files have names of the form [some string].prompt.md (Example: do-logs.prompt.md). By default, prompt files are located at the root of your repo in the .github/prompts directory.
Since the Copilot CLI and REST API are turned off at Schwab, prompt files and custom agents files are the only ways to create a workflow.
You can put your prompt files anywhere if you tell Copilot where to find them. You can specify multiple locations in your VS Code settings:

Unlike the AGENTS.md or copilot-instructions.md files which typically just contain rules for LLMs to follow, prompt files have prompts that you might normally enter in your Copilot Chat window.
Simple Prompt File Example
Here's a simple example of a prompt file that you might create to process log files. We'll name it process-logs.prompt.md:
---
title: "Log File Analysis"
description: "Step-by-step prompts for common log file analysis tasks"
version: "1.0.0"
---

# Log File Analysis Prompts

## Extract Error Messages

1. Search the active log file for all entries containing "ERROR" or "FATAL" log levels.
2. Create a summary table showing the error message and timestamp for each occurrence.

---

## Count Log Entries by Level

1. Parse the active log file and count entries for each log level (ERROR, WARN, INFO, DEBUG).
2. Display the results as a markdown table with log level and count columns.

---

## Find Recent Failures

1. Identify all failed HTTP requests (status codes 4xx and 5xx) in the active log file.
2. Group them by status code and show the top 5 most frequent failure endpoints.

---

## Generate Daily Summary

1. Analyze the active log file and calculate the total entries per hour for the last 24 hours.
2. Create a markdown report showing the hourly breakdown and highlight peak activity periods.
The top of the file begins with a header (called frontmatter) in YAML format. The various values you can use here are described here in the GitHub docs.
Note that each step in the workflow has a heading that describes the activity e.g. Count Log Entries by Level and then a series of steps (for brevity, this example only has two steps per activity).
Check out prompt file examples here on GitHub.
Executing Your Prompt File
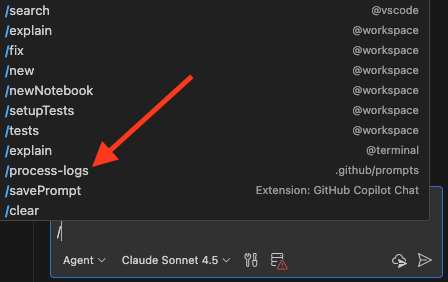
The easiest way to run your prompt file is to simply type a / in Copilot Chat which should bring up a list of tools including any prompt files it found. Recall that we named our sample above process-logs.prompt.md.
- Select your prompt file:
- Make sure any files you want to process (or other input) is attached to the chat window or open in your IDE:

- When your LLM starts processing, it should start by saying that it's using the prompt file:

Creating A Team Using Prompt Files
The previous section give you an example of a workflow that you can run anytime you need to analyze a log file. But can you trust that your chosen LLM is giving you the proper results? In the real world, we verify our work by checking the results ourselves or having someone else do it, so, why not create another prompt file to review the work?
To verify the work done by process-logs.md we'll create another prompt file named check-log-work.md. Here's what it might look like:
---
title: "Log File Analysis Review"
description: "Workflow to audit outputs produced by process-logs.md"
version: "1.0.0"
---

# Log File Analysis Review Prompts

## Preparation

1. Ensure the latest `process-logs.md` results and the source log file are both attached or open.
2. Note the time range, log source, and any preprocessing steps documented by the analyzer run.

---

## Verify Extracted Error Messages

1. Re-scan the log for lines containing `ERROR` or `FATAL` to confirm no entries were missed.
2. Compare timestamps and messages against the analyzer’s table, flagging any mismatches or formatting gaps.

---

## Recount Log Entries by Level

1. Recalculate counts for `ERROR`, `WARN`, `INFO`, and `DEBUG` levels using the same log file.
2. Validate the analyzer’s markdown table totals and note discrepancies greater than 1%.

---

## Audit Recent Failures

1. Rebuild the list of 4xx/5xx requests, ensuring parsing logic matches the analyzer’s assumptions.
2. Confirm grouping by status code and the top 5 failure endpoints, documenting any ties or missing endpoints.

---

## Validate Daily Summary

1. Recompute per-hour entry totals for the last 24 hours, verifying time zone handling.
2. Check that peak periods highlighted by the analyzer align with the recalculated data.

---

## Report Findings

1. Summarize confirmation status (pass/fail) for each analyzer section with supporting evidence.
2. Recommend follow-up actions or reruns if inconsistencies exceed tolerance thresholds.
Now, after we run process-logs.md, which generates a markdown-format file of results, we can run check-log-work.md to help ensure that the results are good.
You can easily create an end-to-end workflow using prompt files. However, custom agent files give you more control over the workflow.